

Excel to Python for Data Analysts: Complete Transition Guide India 2026
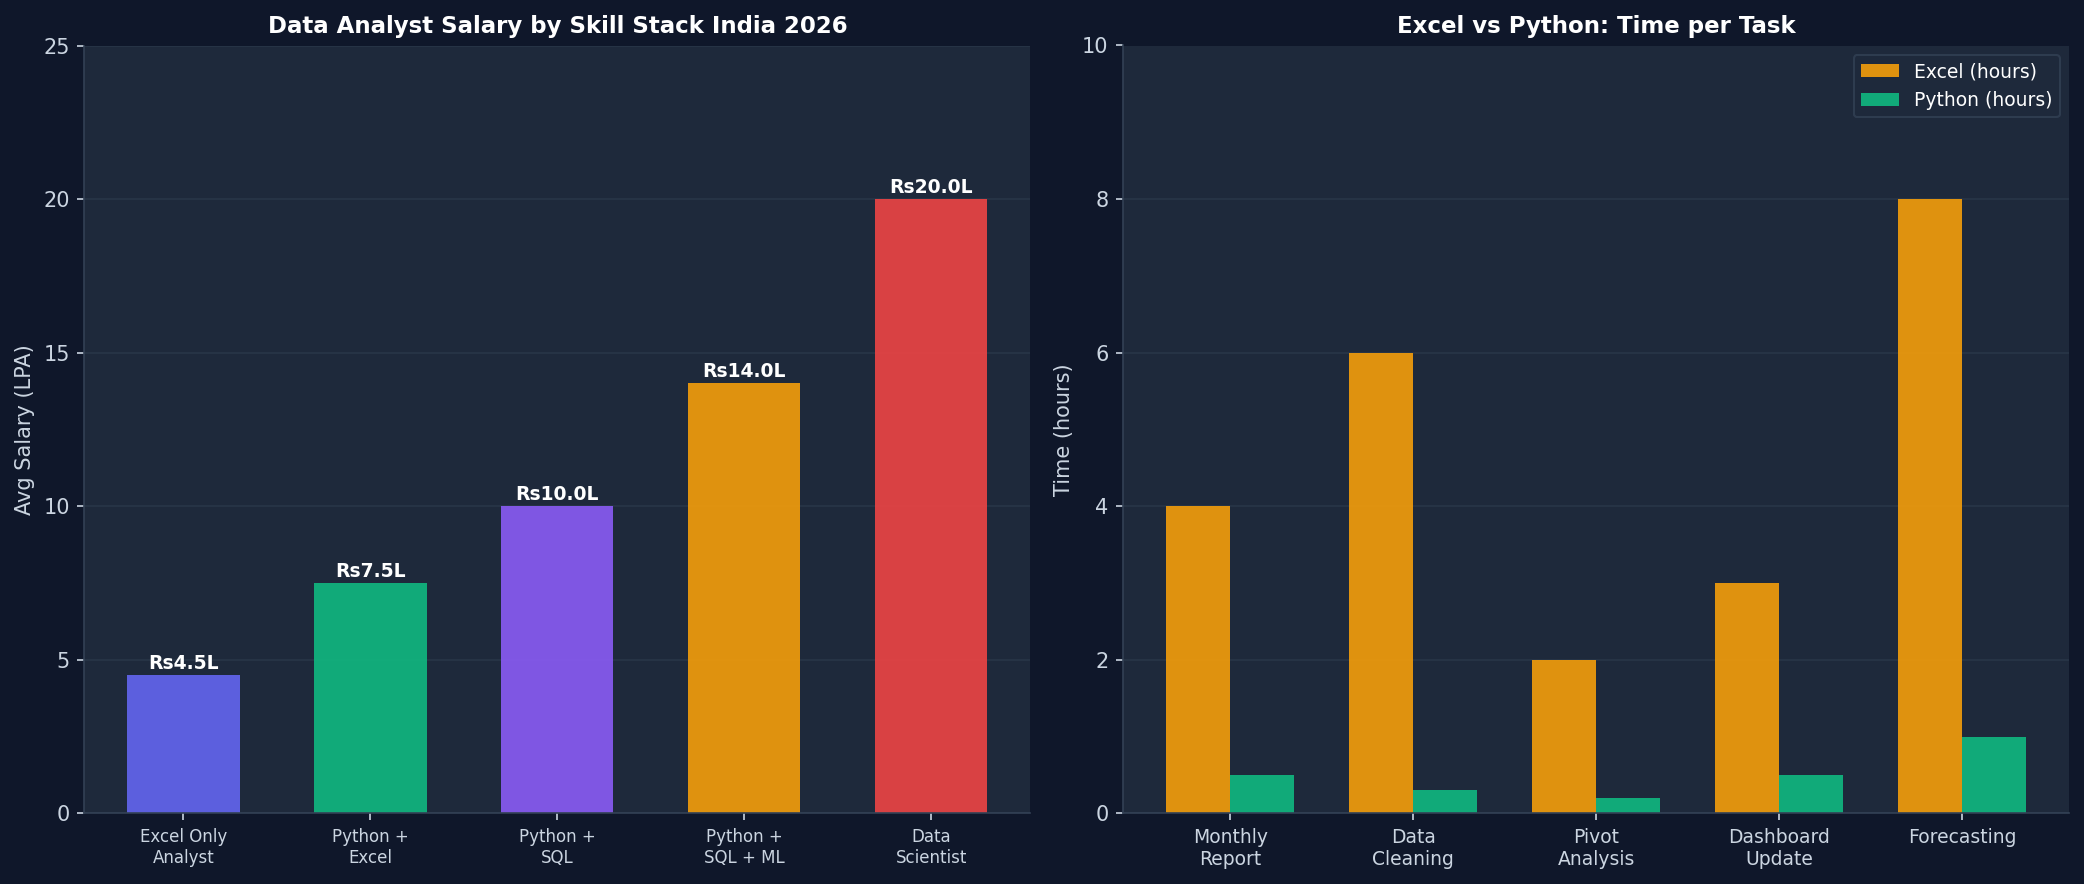
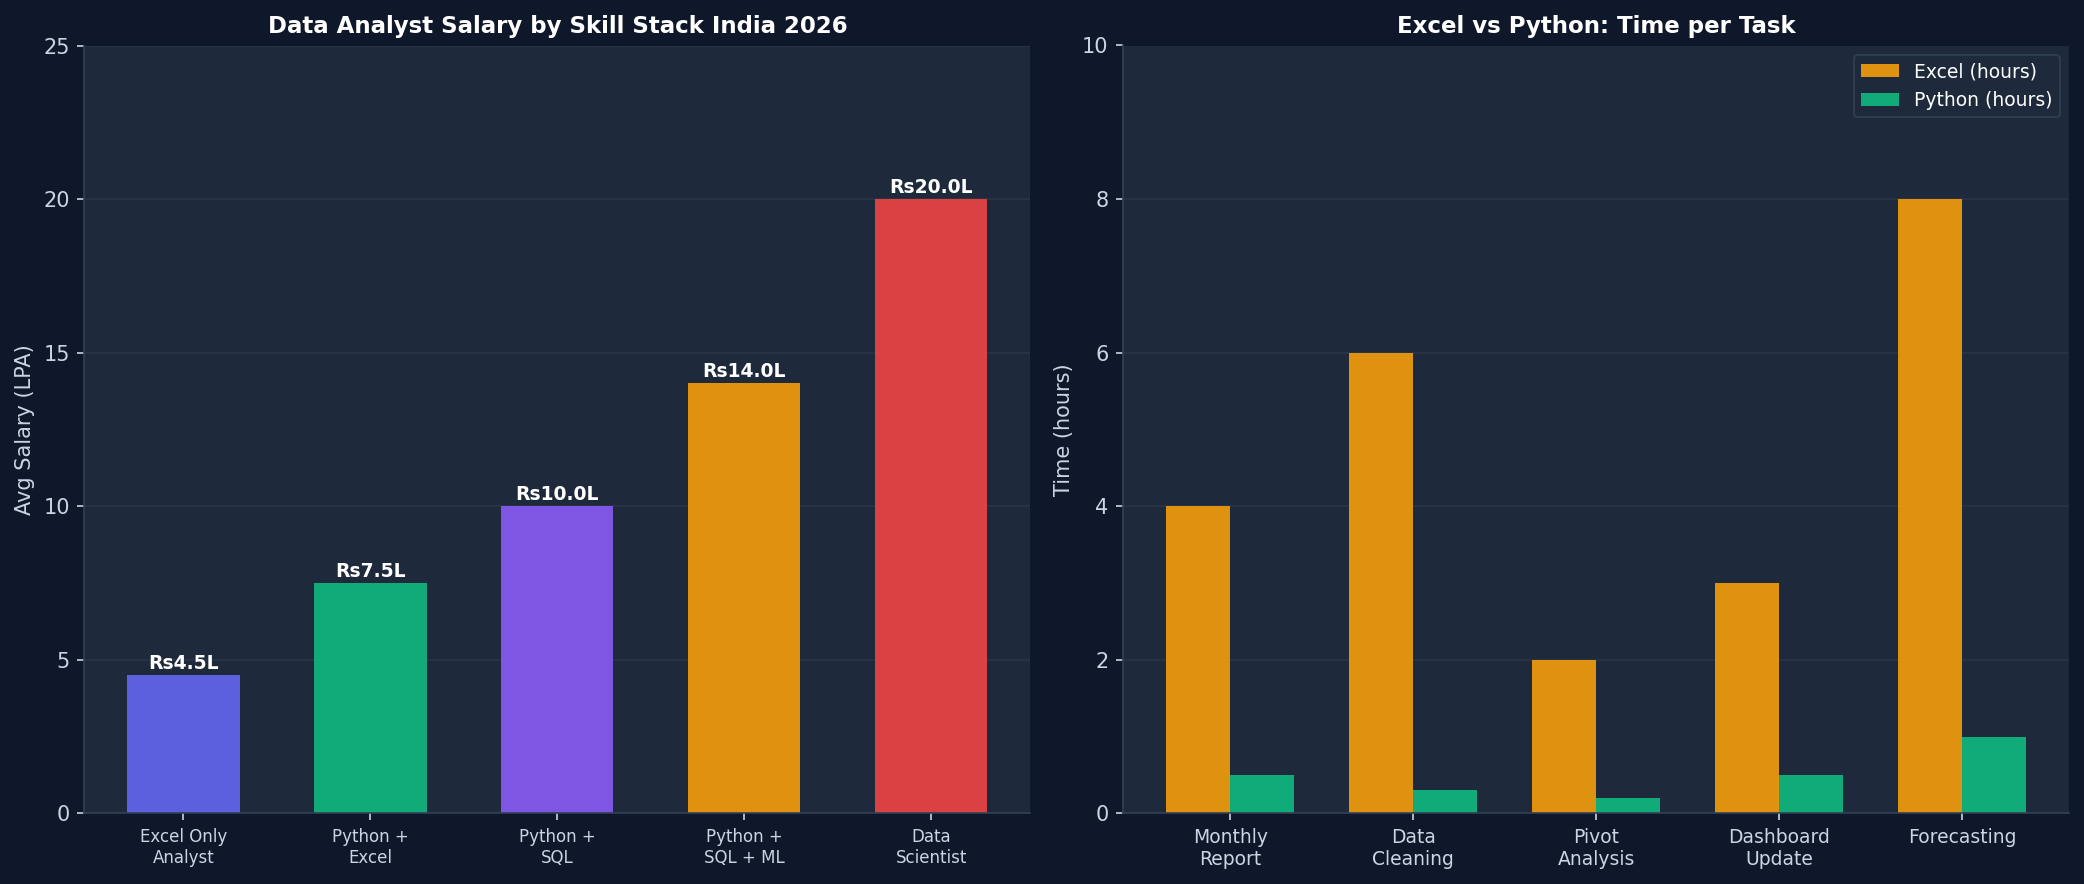
Still doing all your analysis in Excel? Data analysts in India who add Python skills to their Excel knowledge earn 60-80% more — jumping from Rs4-5 LPA to Rs7-12 LPA — and can process data 10-20x faster on tasks that take hours in Excel. This guide shows you exactly how to transition from Excel to Python with direct skill-for-skill comparisons and working code.
Why Python is Now Mandatory for Data Analysts in India
- 92% of data analyst job postings in India require SQL — 78% now require Python (Pandas)
- Excel-only analysts face a Rs4-5 LPA salary ceiling regardless of experience
- Python processes 1 million rows in seconds — Excel crashes above 100K rows
- Automated reports with Python run daily without human intervention
- Python integrates with APIs, databases, ML libraries — Excel cannot
Excel Skills Mapped to Python/Pandas Equivalents
Reading and Loading Data
import pandas as pd

# Excel: File > Open > Select file
df = pd.read_excel("sales_data.xlsx", sheet_name="Sheet1")

# Excel: File > Import > CSV
df = pd.read_csv("sales_data.csv")

# View first 5 rows (like pressing Ctrl+Home in Excel)
print(df.head())

# Check data shape (rows, columns)
print(df.shape)       # (10000, 15)

# Check column names
print(df.columns.tolist())
Filtering Data (Excel: Filter dropdown)
# Excel: Filter > City = "Bangalore" AND Sales > 10000
df_filtered = df[(df['City'] == 'Bangalore') & (df['Sales'] > 10000)]

# Excel: Filter > Month IN {Jan, Feb, Mar}
df_q1 = df[df['Month'].isin(['Jan', 'Feb', 'Mar'])]

# Excel: Filter > remove blank cells in Name column
df_clean = df[df['Name'].notna()]

print(f"Filtered rows: {len(df_filtered)}")
Pivot Tables (Excel: Insert > PivotTable)
# Excel: PivotTable - Rows=City, Values=SUM(Sales)
pivot = df.groupby('City')['Sales'].sum().reset_index()
pivot.columns = ['City', 'Total_Sales']
print(pivot.sort_values('Total_Sales', ascending=False))

# Excel: PivotTable - Rows=Category, Columns=Month, Values=AVG(Sales)
pivot2 = df.pivot_table(
    values='Sales',
    index='Category',
    columns='Month',
    aggfunc='mean'
)
print(pivot2)
VLOOKUP Replacement (Excel: =VLOOKUP)
# Excel: =VLOOKUP(A2, ProductTable, 3, FALSE)
# Python: merge two DataFrames (much more powerful than VLOOKUP)

products_df = pd.read_excel("products.xlsx")
sales_df = pd.read_excel("sales.xlsx")

# Left join — equivalent to VLOOKUP (all sales, matching product info)
merged = sales_df.merge(products_df, on='Product_ID', how='left')
print(merged.head())Charts and Visualization (Excel: Insert > Chart)
import matplotlib.pyplot as plt

# Bar chart by city
city_sales = df.groupby('City')['Sales'].sum()
city_sales.plot(kind='bar', color='steelblue', figsize=(10, 6))
plt.title('Sales by City 2026')
plt.xlabel('City')
plt.ylabel('Total Sales (Rs)')
plt.tight_layout()
plt.savefig('sales_chart.png', dpi=150)
plt.show()
Automated Monthly Report (Excel: Manual copy-paste every month)
import pandas as pd
from datetime import datetime

# This script runs automatically — no manual work needed
def generate_monthly_report():
    df = pd.read_csv("sales_data.csv")
    df['Date'] = pd.to_datetime(df['Date'])

    # Filter this month
    today = datetime.now()
    df_month = df[(df['Date'].dt.month == today.month) &
                  (df['Date'].dt.year == today.year)]

    # Summary stats
    summary = {
        'Total Sales': df_month['Sales'].sum(),
        'Total Orders': len(df_month),
        'Avg Order Value': df_month['Sales'].mean(),
        'Top City': df_month.groupby('City')['Sales'].sum().idxmax()
    }

    # Save to Excel report
    df_month.groupby('City')['Sales'].sum().to_excel(
        f"report_{today.strftime('%Y_%m')}.xlsx"
    )
    print(f"Monthly report generated: {summary}")

generate_monthly_report()
6-Month Excel to Python Transition Plan
- Month 1: Python basics — variables, loops, functions, lists, dicts (not data science specific)
- Month 2: Pandas fundamentals — read/write Excel and CSV, filter, groupby, merge, pivot_table
- Month 3: SQL — SELECT, JOIN, GROUP BY, window functions (works with Python via SQLAlchemy)
- Month 4: Visualization — Matplotlib, Seaborn, Plotly for interactive charts
- Month 5: Build 3 portfolio projects — sales dashboard, customer churn analysis, HR analytics
- Month 6: Job search — target companies with 1-3 years experience DA roles at Rs7-10 LPA
Frequently Asked Questions
Is Python harder to learn than Excel for data analysis?
The learning curve is steeper initially — writing code feels harder than clicking menus. But Python becomes faster than Excel for most tasks after 2-3 months of practice. The key is making direct comparisons: every time you do something in Excel, replicate it in Python the same day. You will be surprised how quickly it clicks.
Do data analyst jobs in India require Python?
Yes — 78% of data analyst job postings in India now list Python as a required or preferred skill. Entry-level roles may not require advanced Python, but basic Pandas and data manipulation is expected at any company beyond a traditional Excel-only shop. SQL + Python is the minimum viable skill set for 2026.
Should I learn R or Python for data analysis in India?
Python. R has a niche role in academic research and specialized statistical work, but the Indian job market is overwhelmingly Python. 78% of DA job postings specify Python vs less than 8% for R. Python also has better integration with web scraping, APIs, ML, and automation — skills that increase your value beyond pure data analysis.
How long does it take to transition from Excel analyst to Python data analyst?
With 2 hours daily practice: 4-6 months to reach job-ready level for junior Python data analyst roles. The fastest path is enrolling in a structured course (not self-study from random YouTube videos) that mirrors the exact tools used in Indian DA job market — SQL + Python + Pandas + a visualization tool.
