

Tableau vs Power BI: Which to Learn for Data Analytics Jobs in India 2026
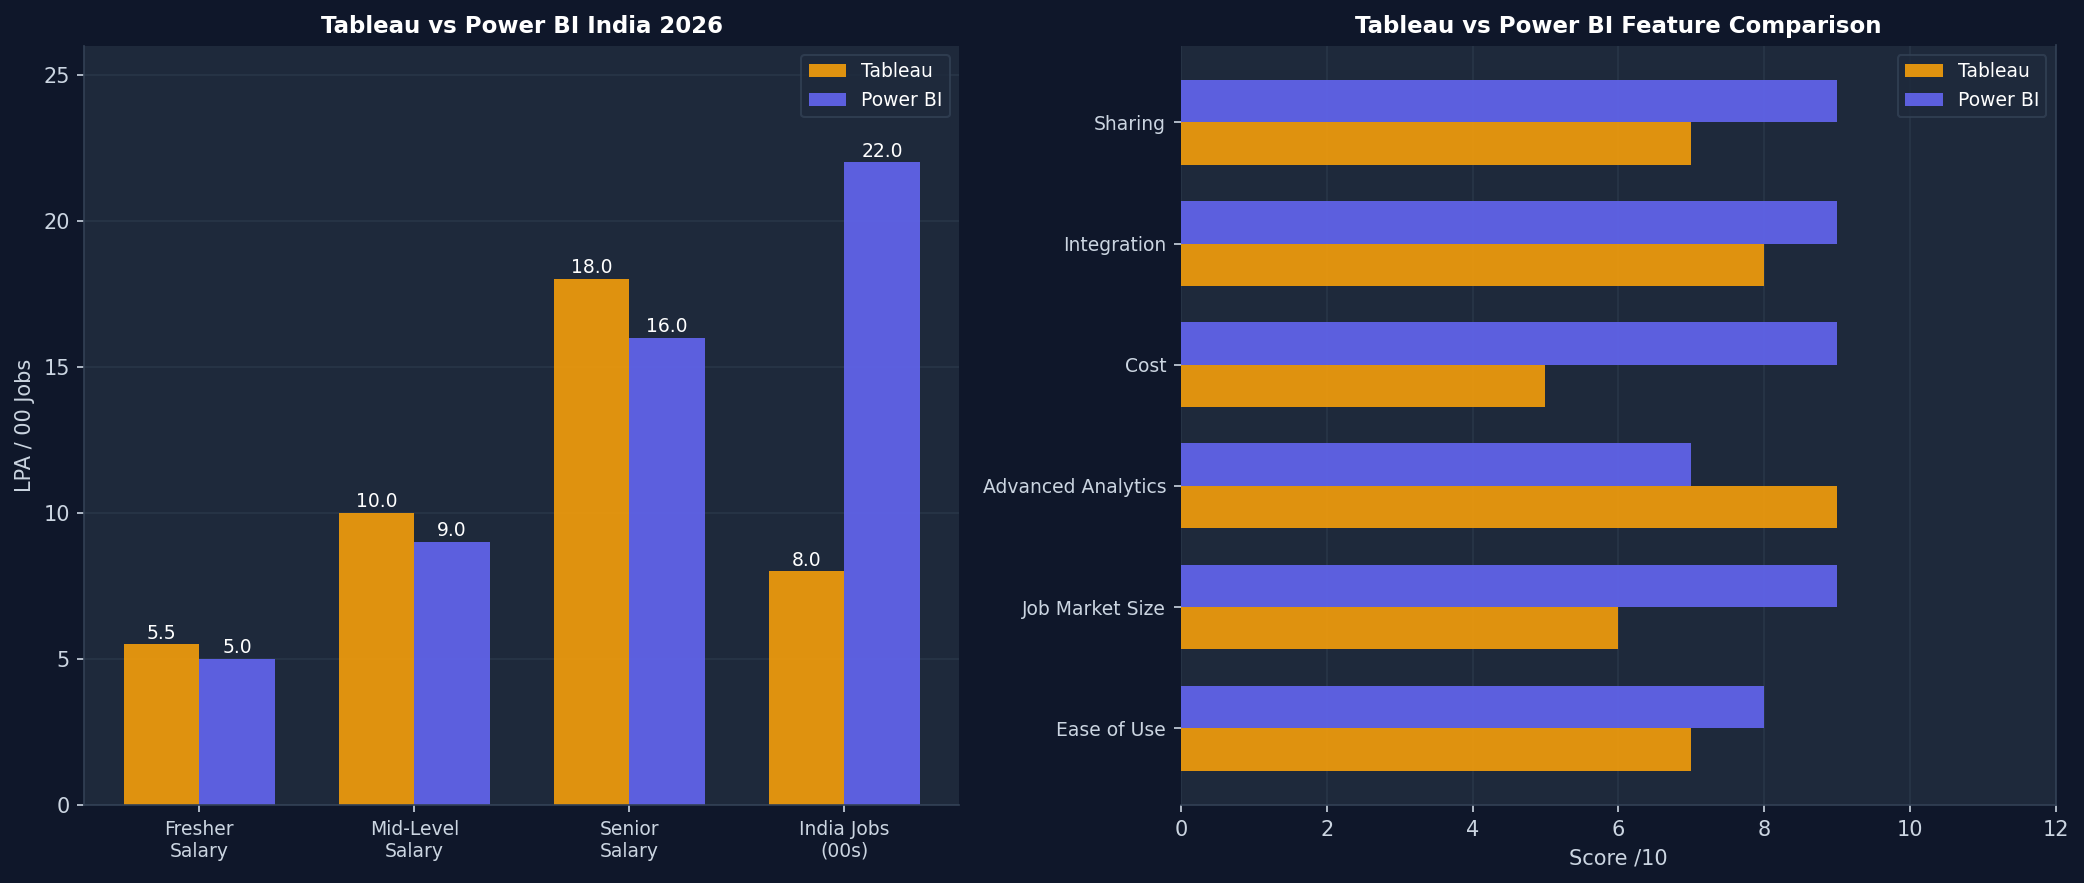
Tableau vs Power BI — which visualization tool should you learn for data analytics jobs in India in 2026? Learn Power BI first if you are targeting the India job market — it has 22,000+ job postings vs Tableau’s 8,000+, integrates natively with Microsoft tools used by 90% of Indian companies, and costs nothing for individuals to learn. Add Tableau later for global MNC and consulting firm opportunities.

Tableau vs Power BI: Complete Comparison
| Factor | Power BI | Tableau |
|---|---|---|
| Price | Free desktop app, Rs720/user/month for sharing | Rs6,500/month (Creator), free Tableau Public |
| India Job Market | 22,000+ job postings on Naukri | 8,000+ job postings on Naukri |
| Ease of Use | Easier for Excel users (drag-drop familiar) | Steeper learning curve, more flexible |
| Advanced Analytics | DAX language for complex calculations | LOD expressions, more statistical charts |
| Data Sources | 100+ connectors, Excel/SharePoint native | 70+ connectors, Hyper engine for large data |
| Sharing Dashboards | Power BI Service (requires paid license for viewers) | Tableau Public (free, public) or Tableau Server (paid) |
| AI Features | Copilot integration, Q&A natural language | Tableau Pulse AI, Einstein Discovery |
| Best For | IT firms, FMCG, banking, retail in India | Consulting, global MNCs, data-heavy analytics teams |
| Portfolio Sharing | Power BI Service (free tier limited) | Tableau Public (best for portfolio — free, shareable link) |
When Power BI is the Right Choice
Choose Power BI first if:
- Your target companies are IT MNCs (TCS, Infosys, Wipro, HCL) — Power BI is their BI standard
- You already use Excel — Power BI imports Excel files natively and the interface feels familiar
- Your company uses Microsoft 365 (Teams, SharePoint) — Power BI integrates seamlessly
- You are targeting FMCG, banking, insurance, or retail roles in India
- You want to build a portfolio quickly — Power BI Desktop is free and full-featured
Power BI Learning Path (4-6 weeks)
- Week 1: Import Excel/CSV data, build basic bar, line, pie charts, cards
- Week 2: Power Query — clean data, rename columns, merge tables, unpivot
- Week 3: DAX basics — CALCULATE, SUMX, FILTER, time intelligence (SAMEPERIODLASTYEAR)
- Week 4: Build complete dashboard — KPI cards, trend charts, drill-through, slicers
- Week 5-6: Publish to Power BI Service, schedule refresh, share with stakeholder mock
When Tableau is the Right Choice
Choose Tableau first if:
- You are targeting consulting firms: Deloitte, McKinsey, BCG, EY, KPMG India
- You want a free, public portfolio — Tableau Public is the best free portfolio platform for DA roles
- Your target companies are global MNCs with India centers: Salesforce, Google, Amazon analytics teams
- You are working with large datasets (Tableau’s Hyper engine is faster than Power BI for big data)
- You want to build advanced statistical visualizations not available in Power BI
Tableau Learning Path (4-6 weeks)
- Week 1: Connect data, build bar, line, scatter, map charts on Tableau Public
- Week 2: Calculated fields, filters, parameters, sets
- Week 3: Table calculations, LOD expressions (FIXED, INCLUDE, EXCLUDE)
- Week 4: Build complete interactive dashboard with actions, filters, tooltips
- Week 5-6: Publish to Tableau Public, get feedback, refine, add to portfolio
Which Pays More: Tableau or Power BI in India?
Tableau specialists earn slightly more at the senior level — Rs18-22 LPA vs Rs16-20 LPA for Power BI at 5+ years. This is because Tableau roles are concentrated in consulting and high-paying MNCs. At fresher level, the salary difference is minimal: Rs5-5.5 LPA (Tableau) vs Rs5-6 LPA (Power BI).
Bottom line: the tool matters less than the quality of your dashboards and your SQL/Python skills alongside visualization.
Frequently Asked Questions
Can I learn both Power BI and Tableau for data analytics jobs?
Yes — and this is ideal. Both tools take 4-6 weeks each to reach interview-ready level. Learning both takes 3 months total. Engineers with both Power BI and Tableau skills qualify for a wider range of roles and can negotiate 10-15% higher salary by demonstrating tool versatility.
Is Tableau better than Power BI for data visualization?
For visual customization and complex analytics, Tableau is more powerful. For integration with Microsoft ecosystem, ease of use for Excel users, and raw India job market volume, Power BI wins. “Better” depends entirely on your use case and target industry.
Which is easier to learn: Tableau or Power BI?
Power BI is easier to start — the interface is familiar to Excel users and basic charts are created with fewer clicks. Tableau has a steeper learning curve but offers more flexibility. Most data analysts find Power BI takes 3-4 weeks to reach basic proficiency vs 4-6 weeks for Tableau.
Do I need to be certified in Power BI or Tableau for jobs?
Certifications are helpful but not mandatory. A working dashboard portfolio on Tableau Public or Power BI Service demonstrates more real skill than a certificate. However, the Microsoft PL-300 (Power BI Data Analyst) certification is valued by MNCs and adds credibility for campus placements where interviewers lack time to review portfolios.
